Infographics
Explore our key data and latest trends in identification and response to child sexual abuse in digestible infographics
We must formally recognise that children represent a significant proportion of victims and ensure their specific needs are met with sufficient and appropriate support.
Children are disproportionately likely to be victims of sexual offences
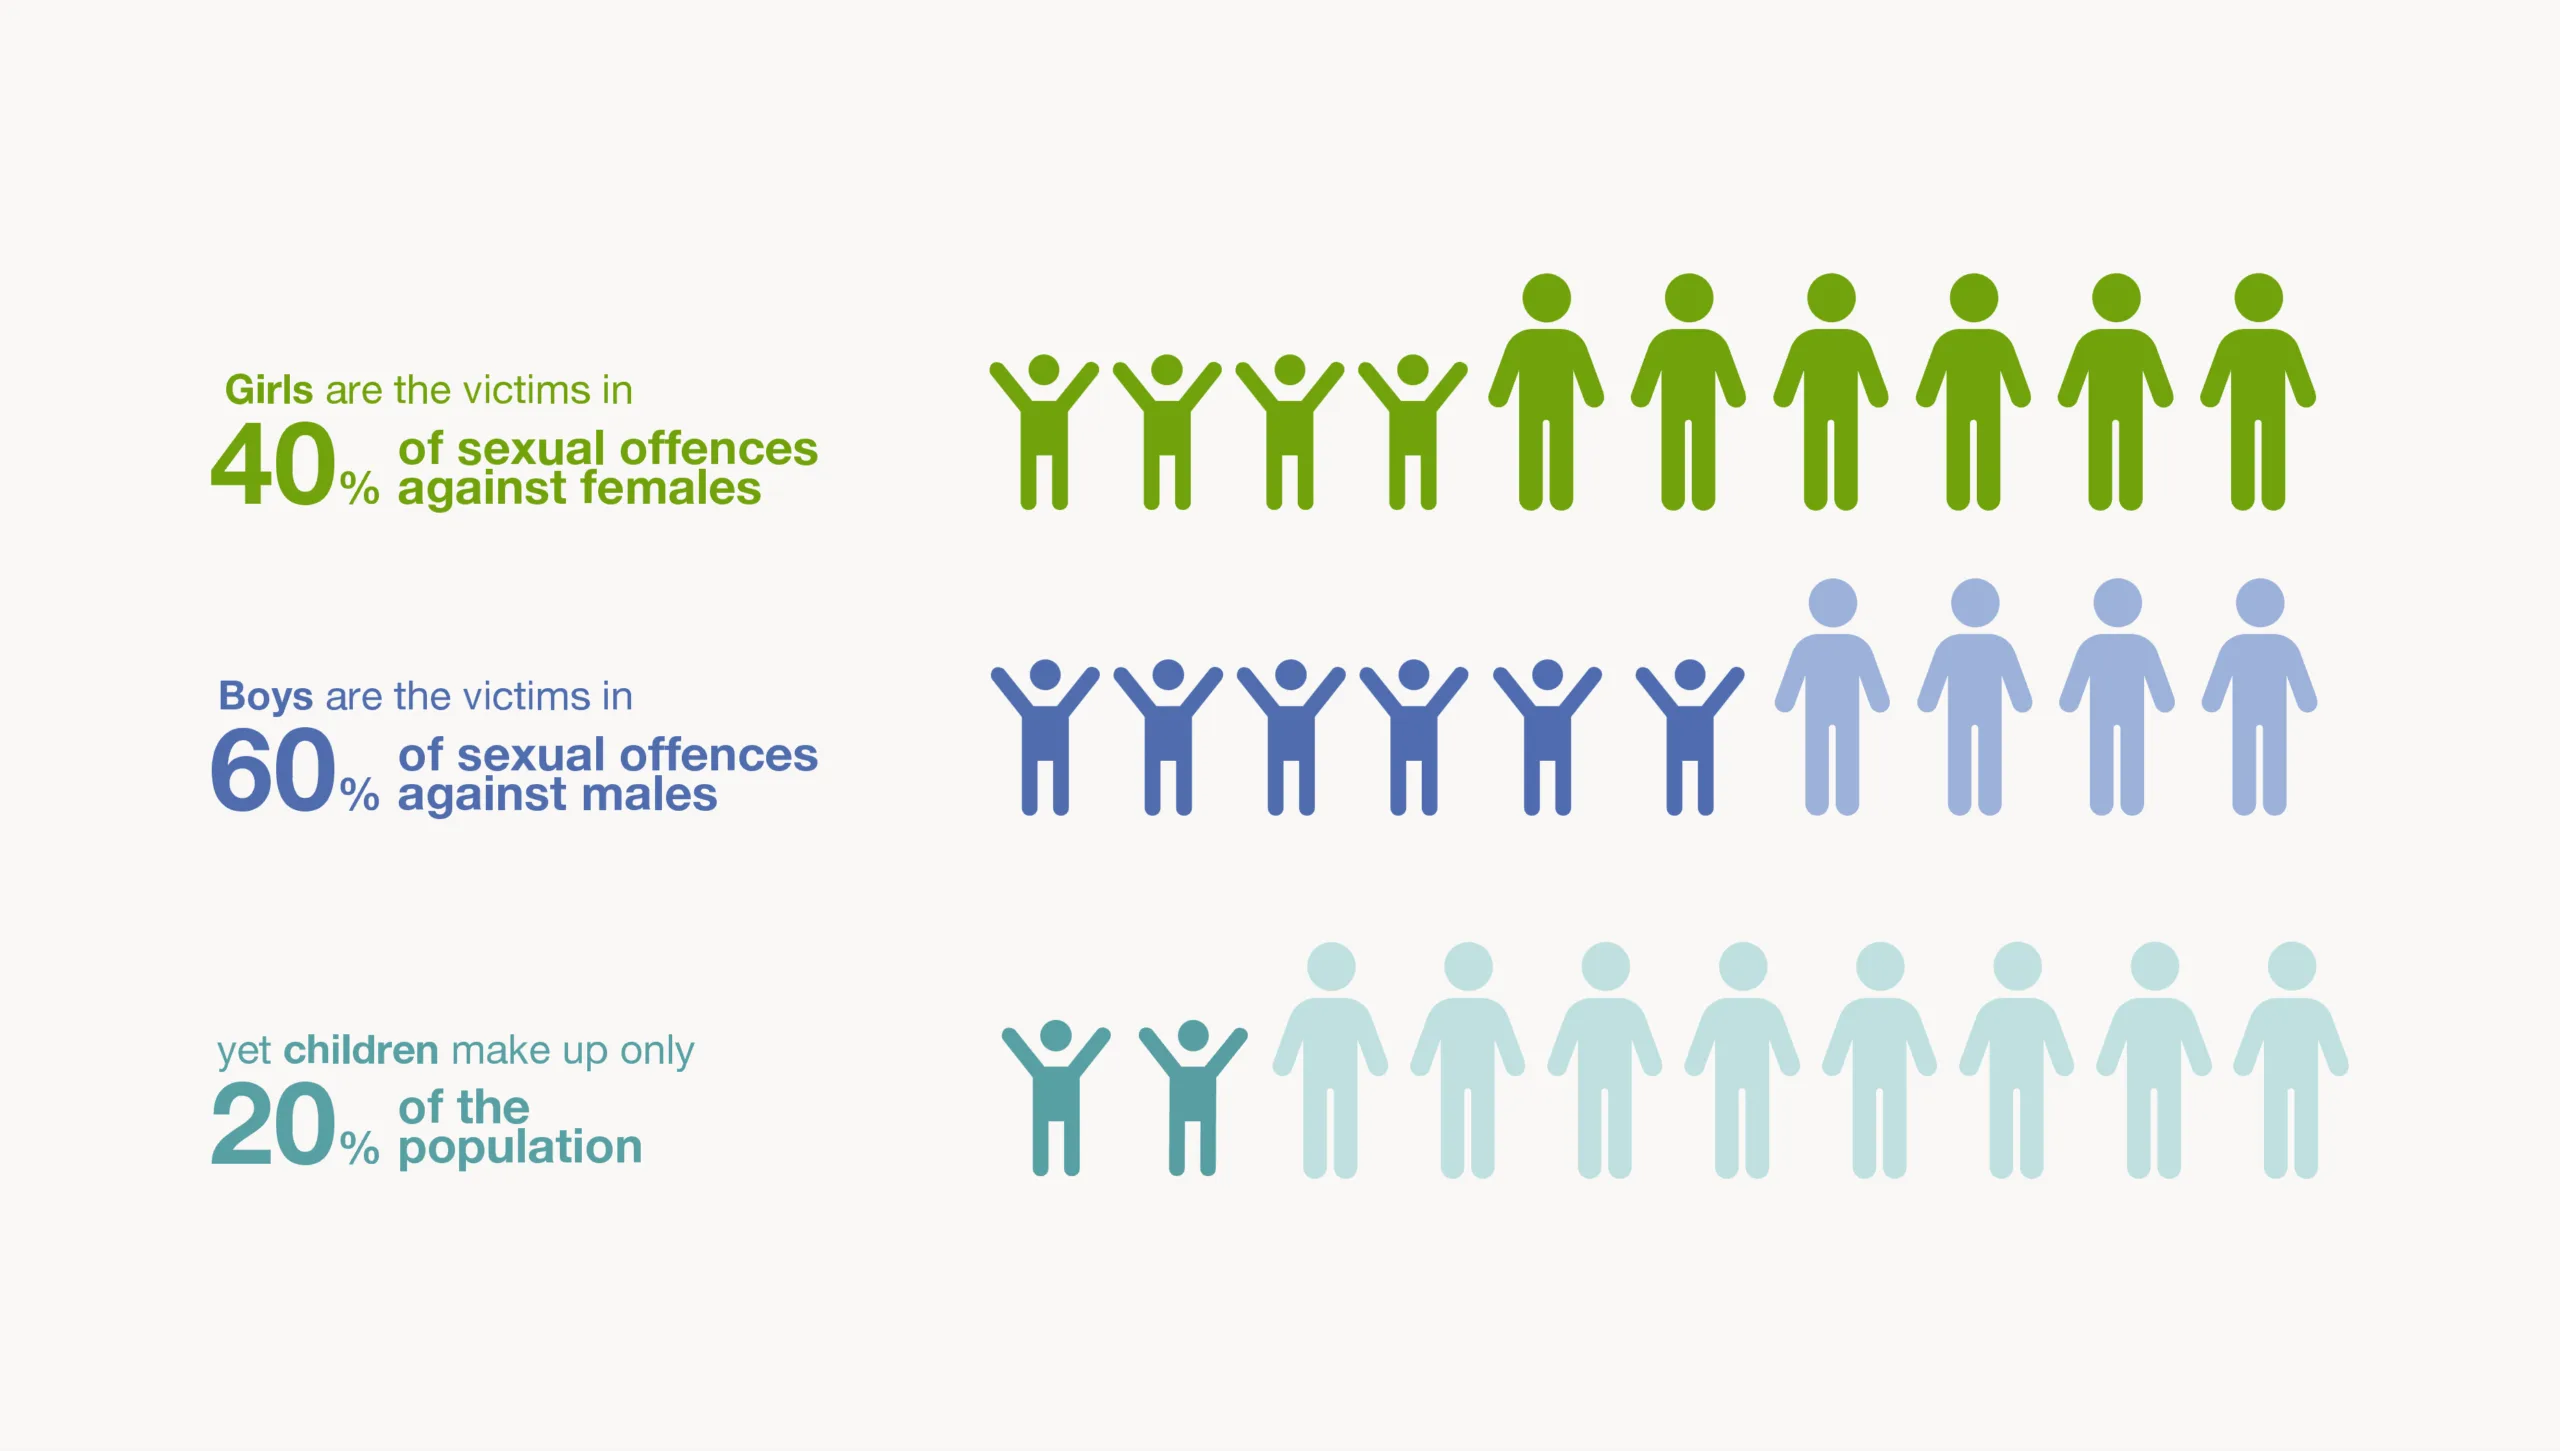
References: Office for National Statistics, 2025: Sexual offences prevalence and victim characteristics, England and Wales: Year ending March 2025
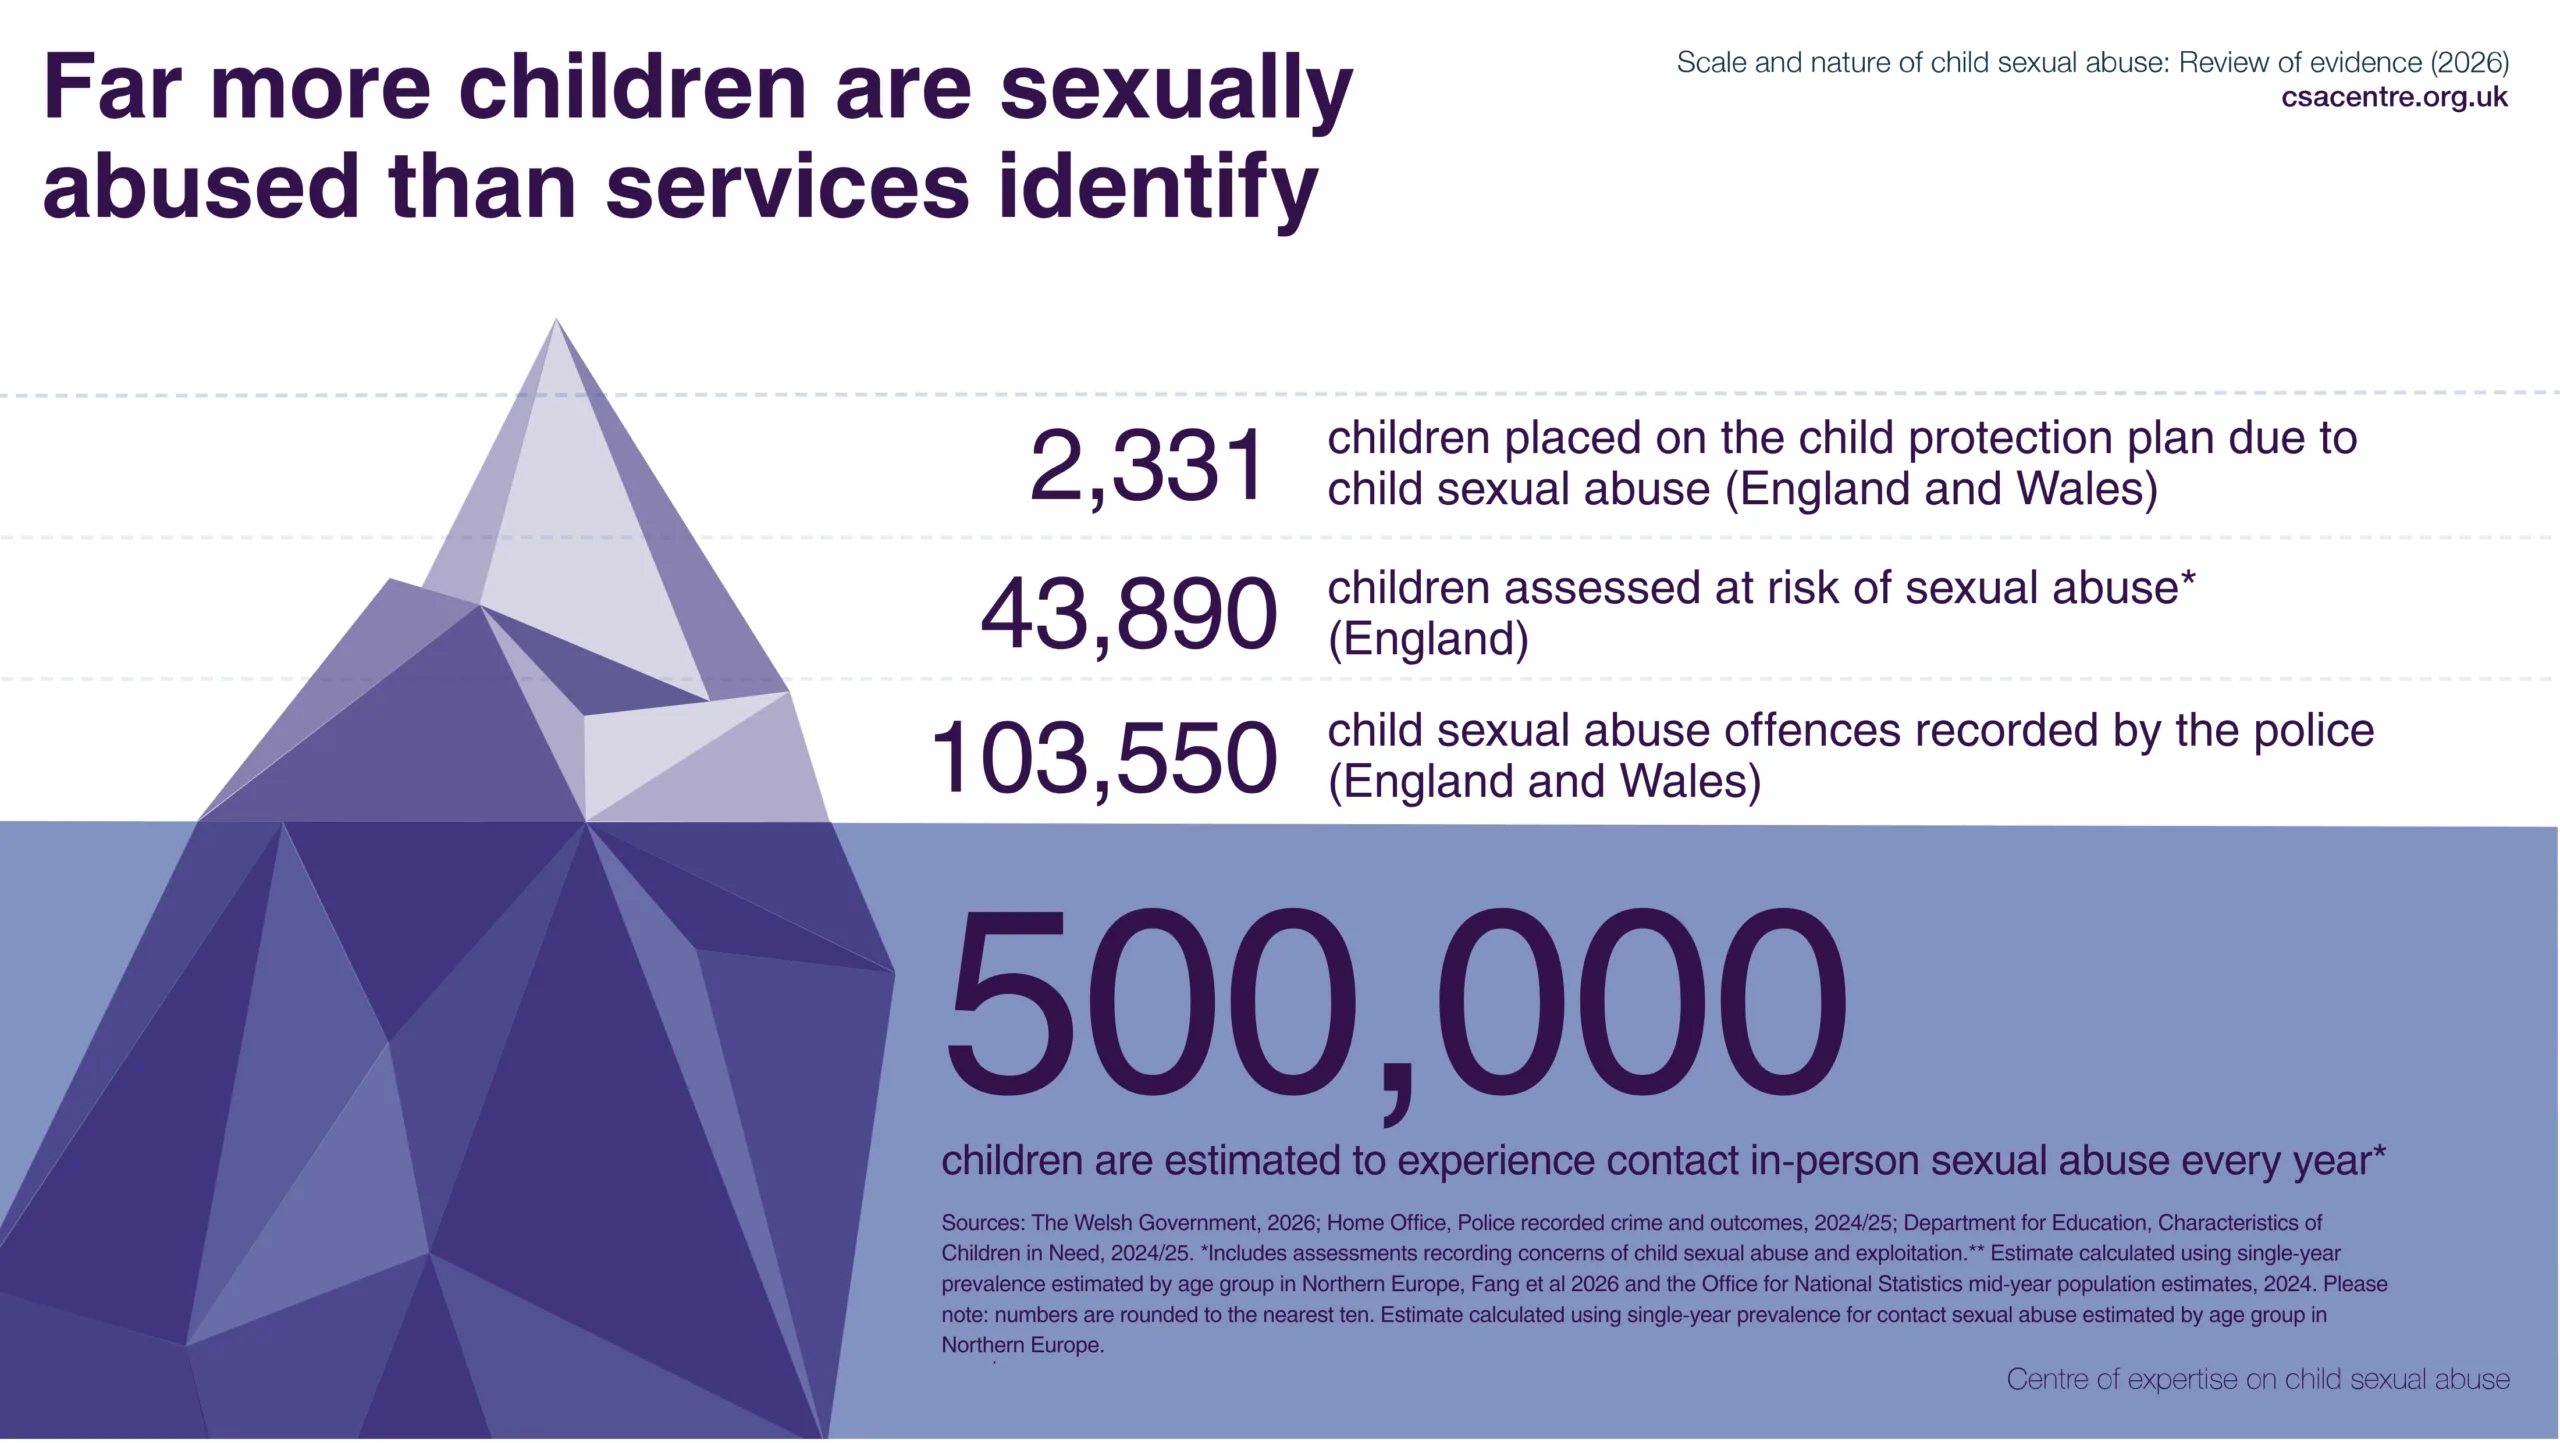
Concerns of sexual abuse are far less likely to be identified and named than other forms of abuse and neglect
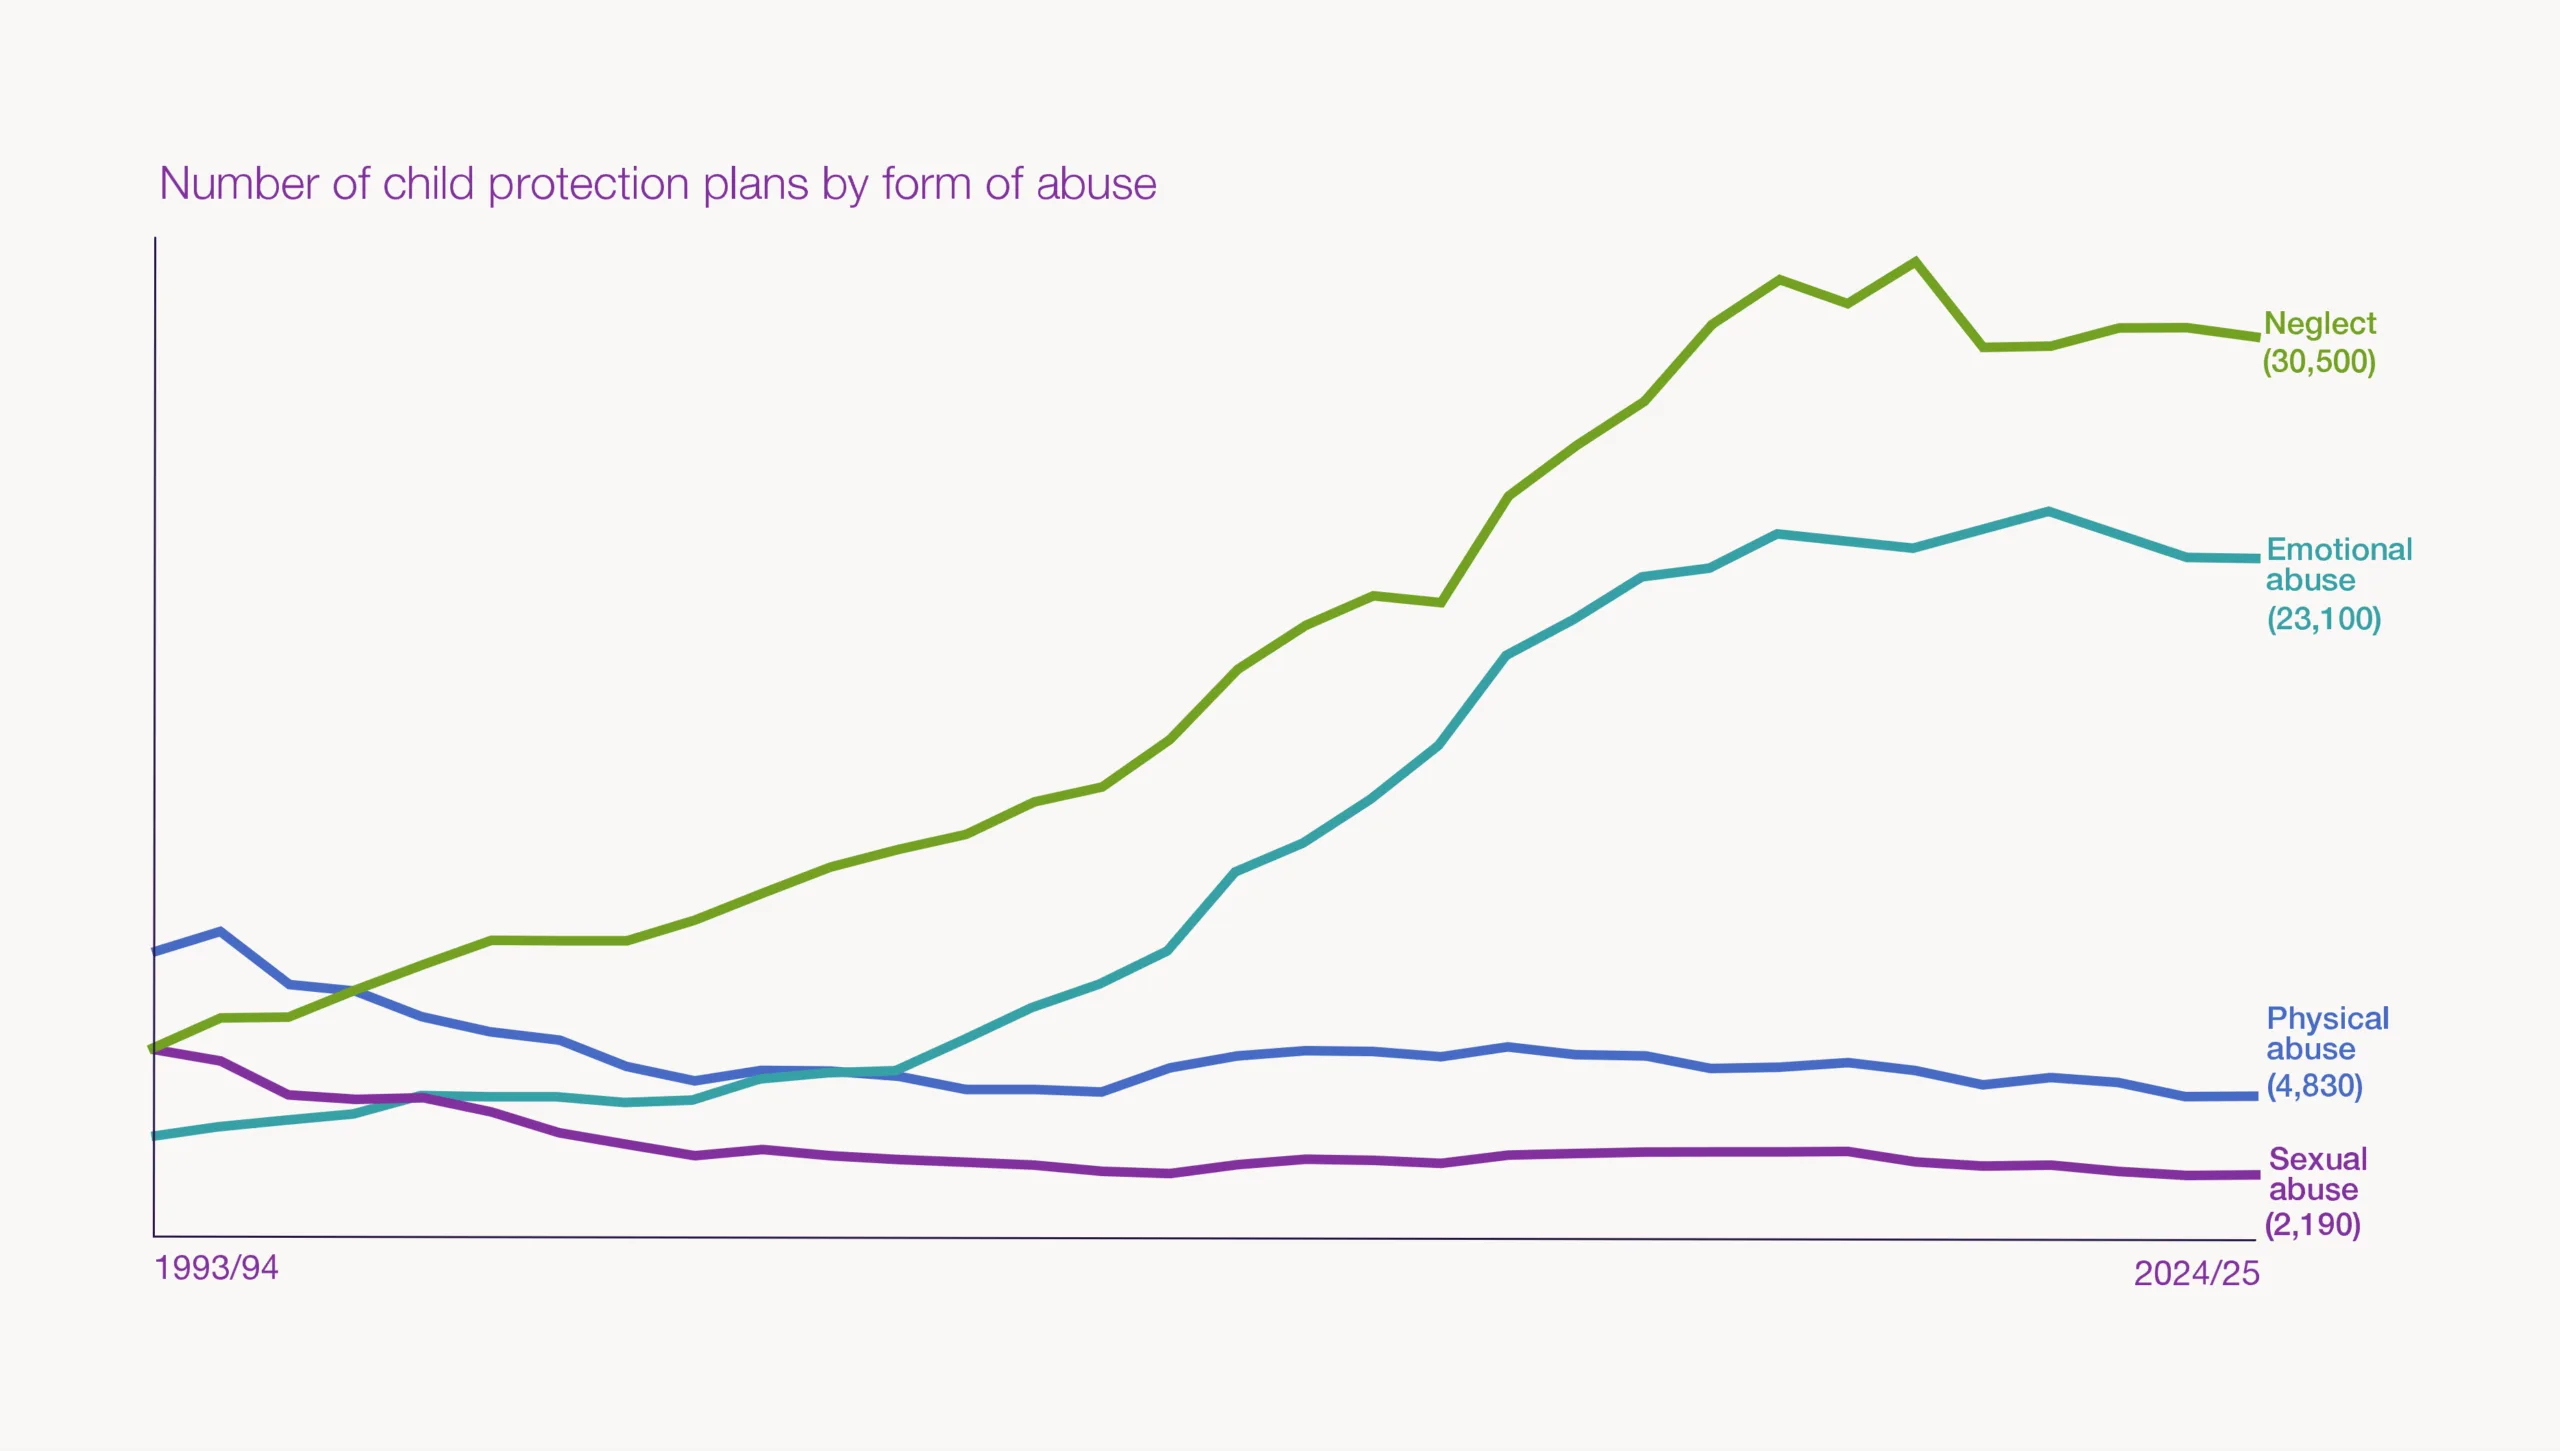
References: Department for Education, Characteristics of Children in need, 2024/25
Where children live matters
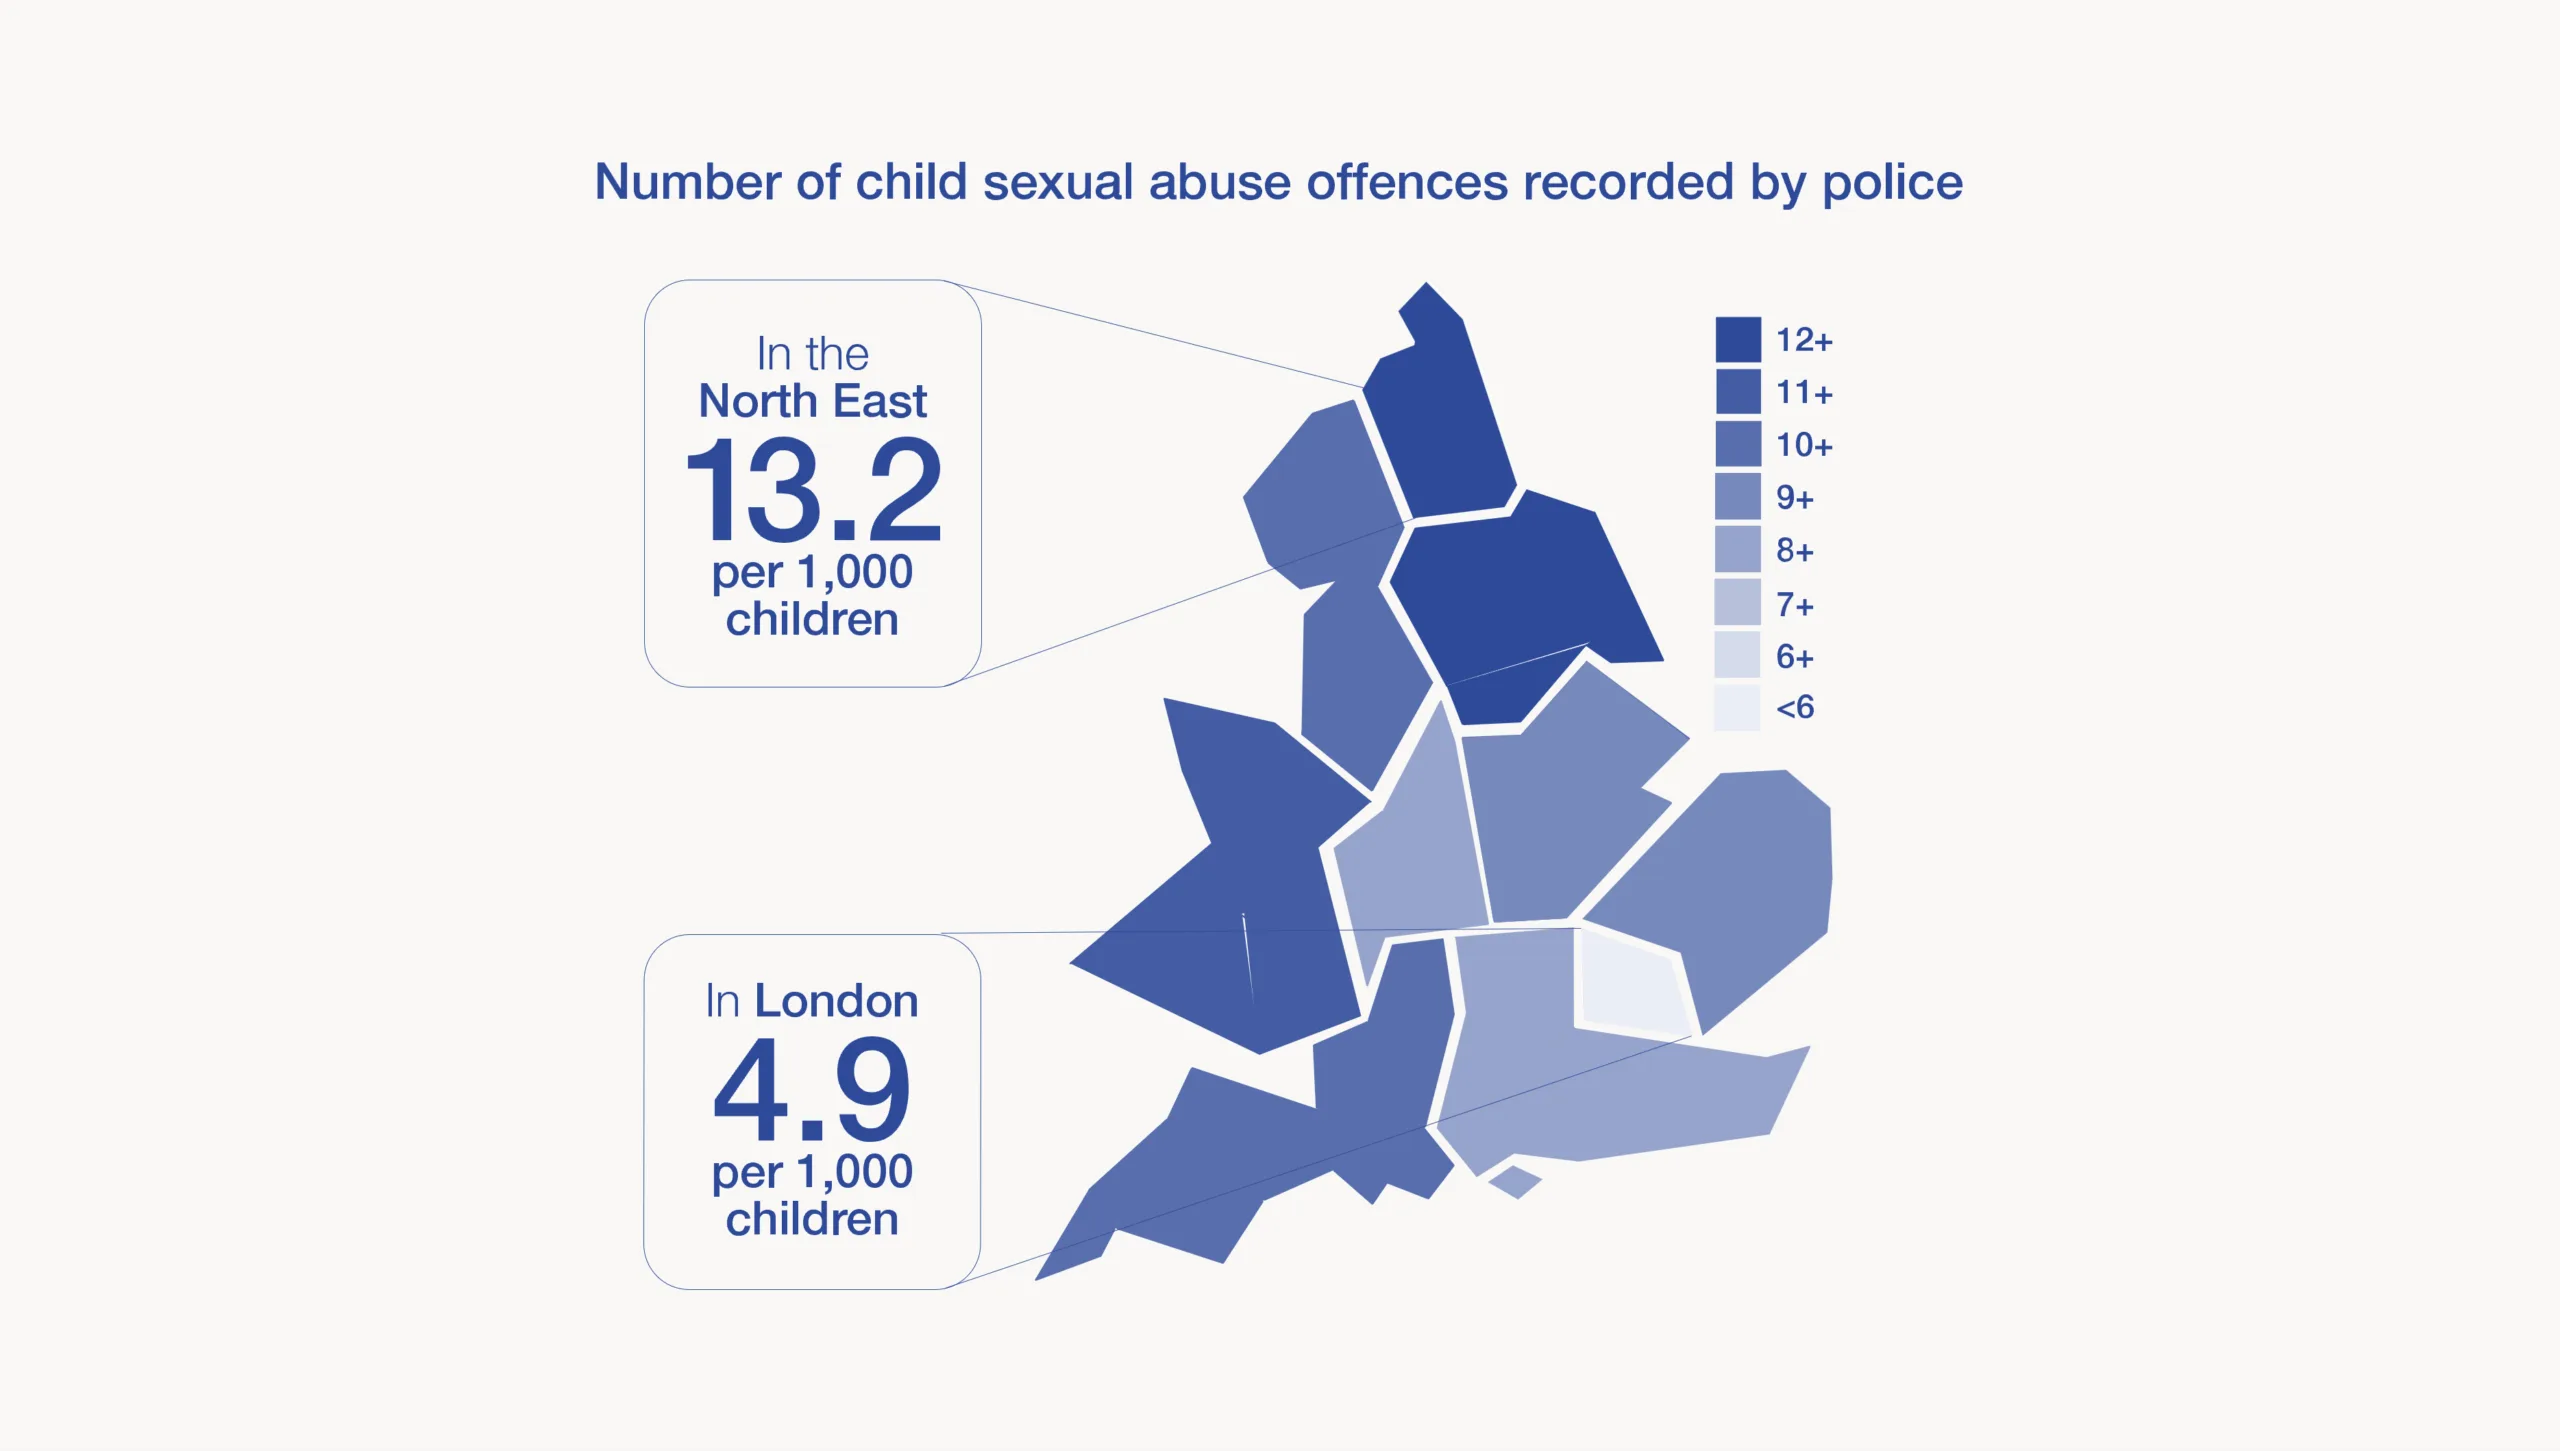
References: Home Office, Police recorded crime and outcomes 2024/25
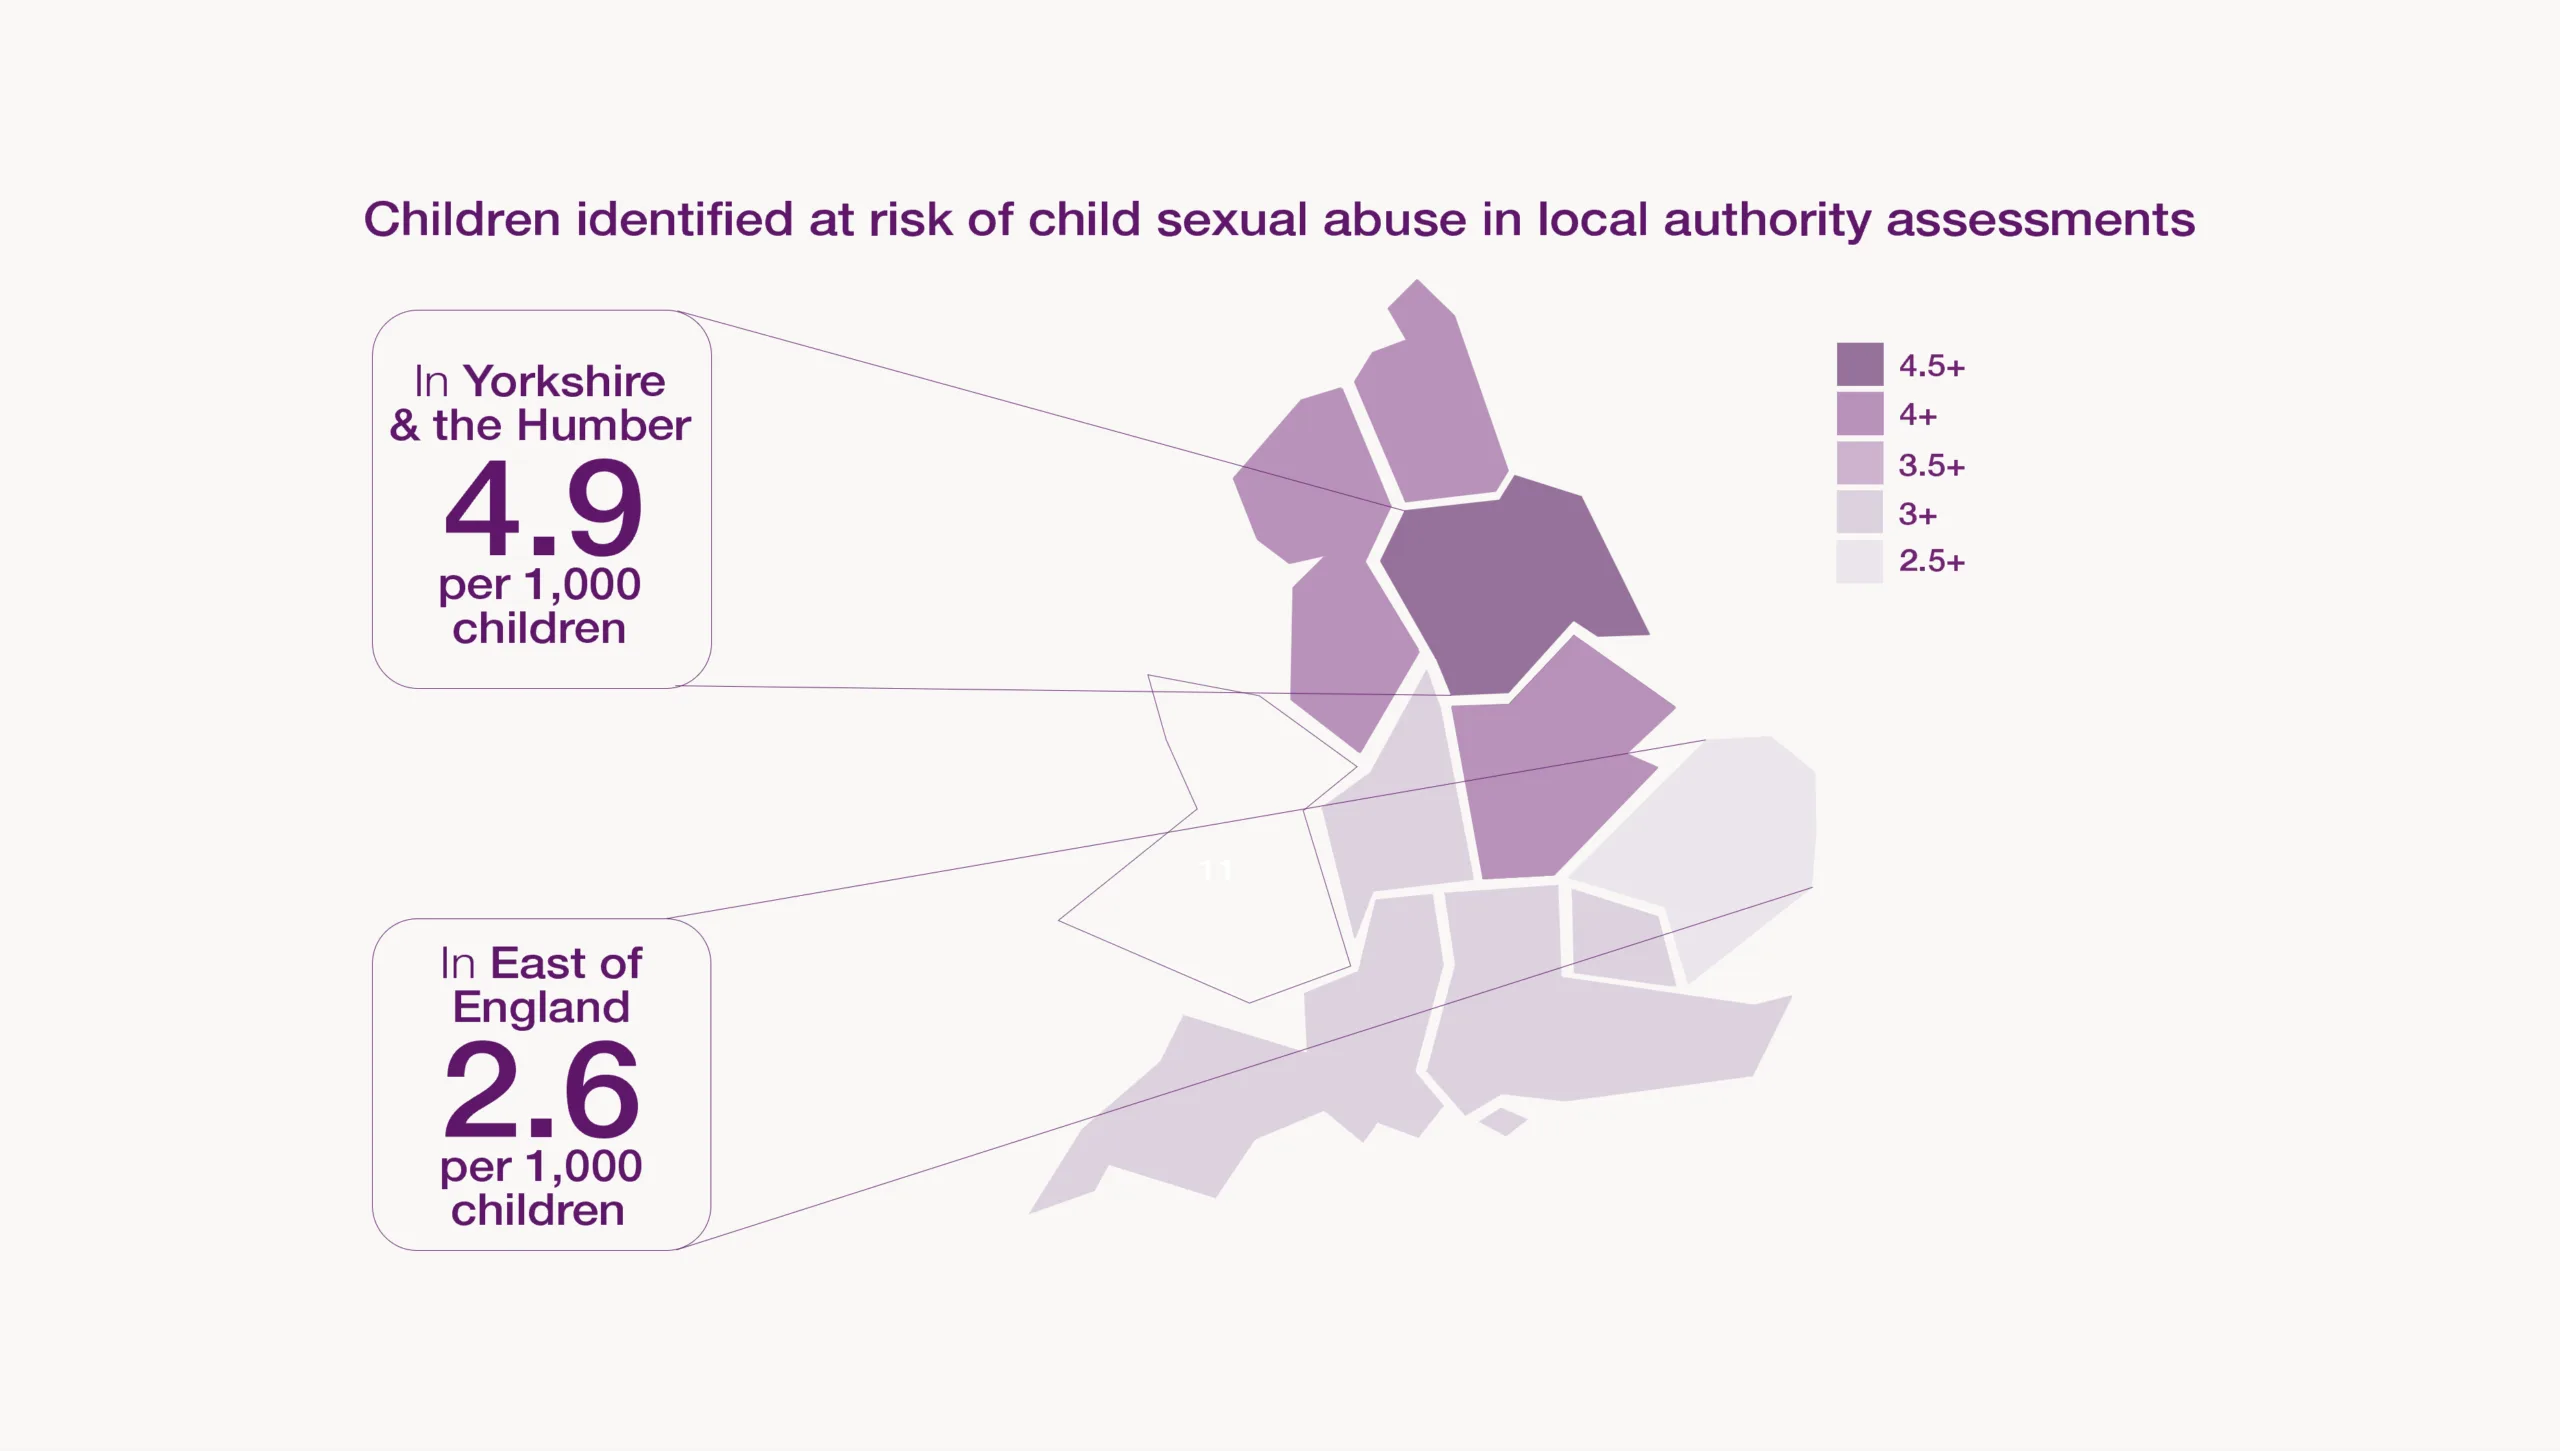
References: Department for Education, Characteristics of children in need 2024/25. Includes assessments recording concerns of child sexual abuse and exploitation.
Child sexual abuse is prevalent across England and Wales but where children live impacts whether that abuse is responded to.
These maps show the average rates within each region; there are wide differences in rates across regions between individual police forces and local authorities.
More child sexual abuse offences are reaching the criminal justice system, but court cases are taking longer to conclude
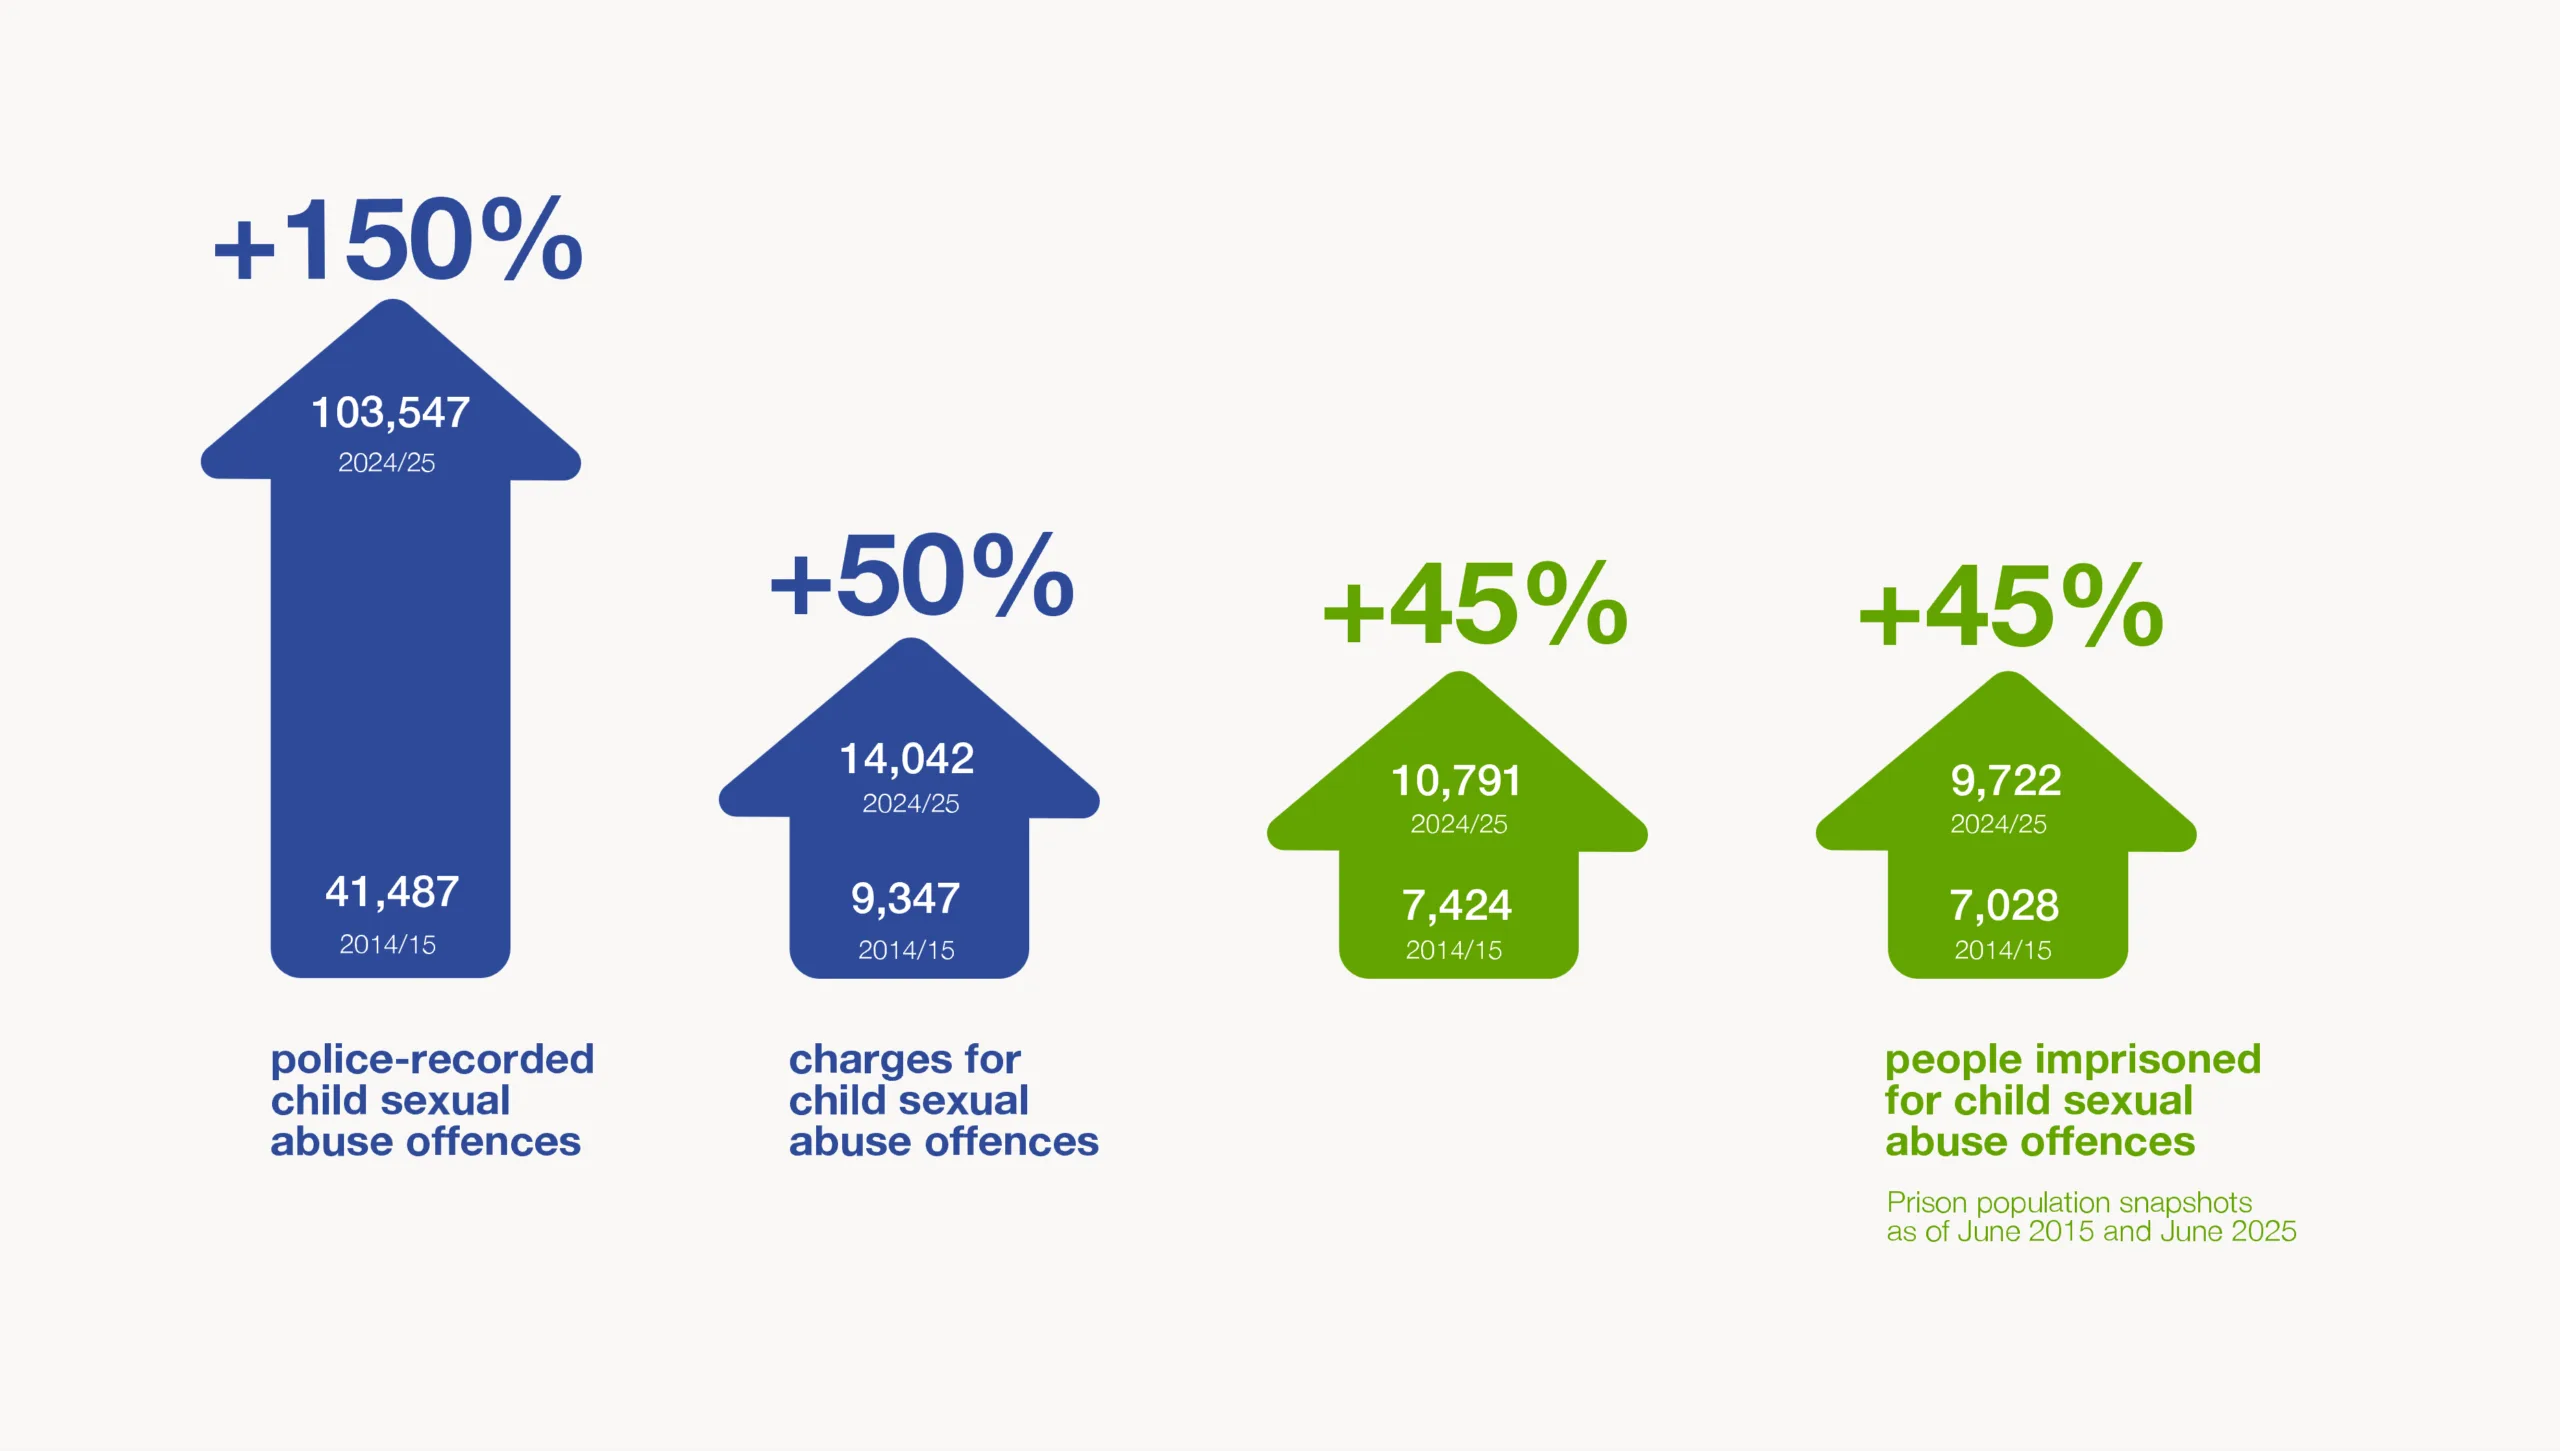
References: Home Office, Police recorded crime and outcomes 2024/25: Ministry of Justice, 2023 and 2024. FOI request. Ministry of Justice Criminal Justice System Statistics, Outcomes by Offence data tool 2024: Prison population annual data June 2025. Figures give an average between a charge/summons and conclusion at court.
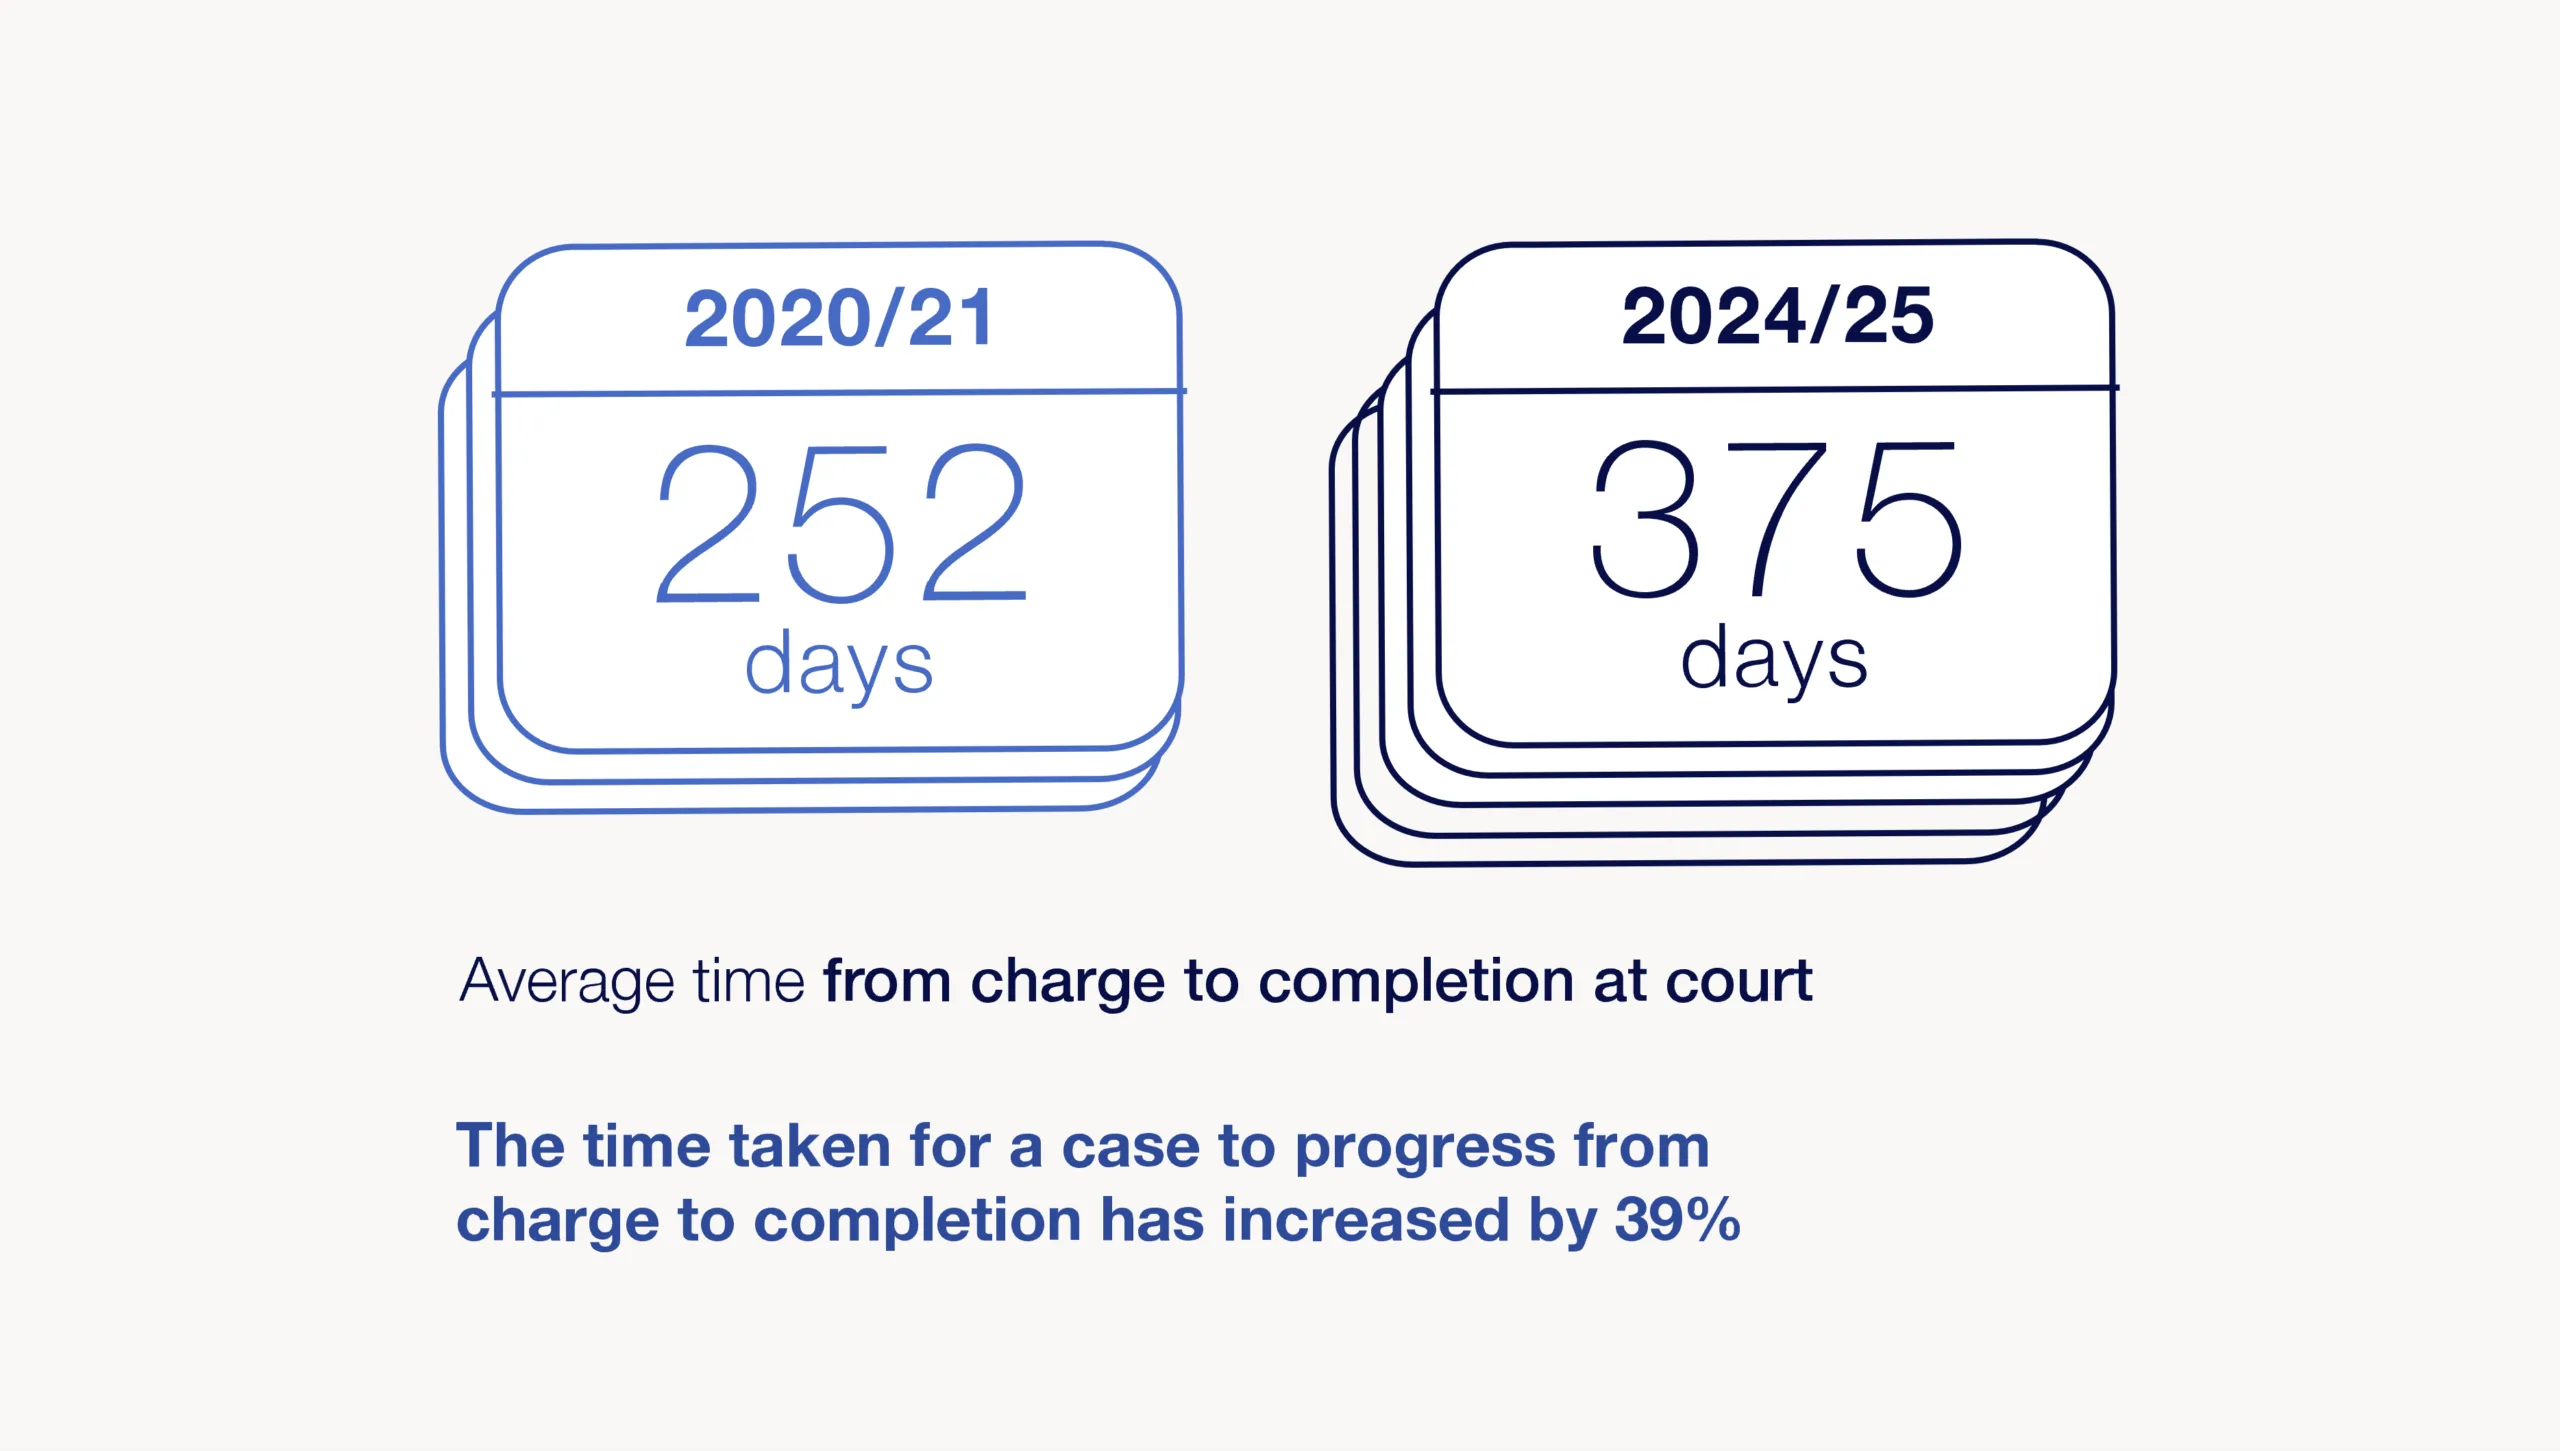
References: Home Office, Police recorded crime and outcomes 2024/25: Ministry of Justice, 2023 and 2024. FOI request. Ministry of Justice Criminal Justice System Statistics, Outcomes by Offence data tool 2024: Prison population annual data June 2025. Figures give an average between a charge/summons and conclusion at court.
What we know about support provision